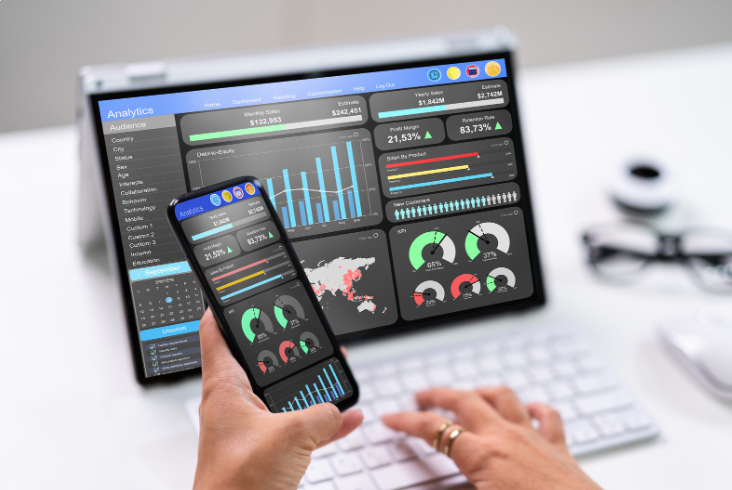
In today’s digital landscape, data is king. Businesses rely on data to make informed decisions and drive growth. Google Analytics has long been a cornerstone for gathering website data, but to truly leverage its power, one must dive into advanced features such as custom reports and dashboards. In this blog post, we’ll explore how to master Advanced Google Analytics and create custom reports and dashboards that will revolutionize your data analysis in 2024.
Why Use Custom Reports and Dashboards?
Custom reports and dashboards in Google Analytics allow you to tailor data presentation to your specific needs. This enables you to focus on the metrics that matter most to your business. Whether you’re tracking e-commerce performance, monitoring user behavior, or analyzing marketing campaigns, custom reports provide insights that standardized reports can’t offer.
Getting Started with Custom Reports
Understanding Custom Reports
Custom reports in Google Analytics are designed to meet your unique data requirements. They allow you to choose the dimensions (attributes of your data) and metrics (quantitative measurements) you want to analyze. This flexibility ensures that you can create reports that align perfectly with your business goals.
Creating Your First Custom Report
- Log in to Google Analytics: Navigate to the Google Analytics dashboard and select the account and property you want to work with.
- Access the Customization Tab: In the left-hand menu, click on “Customization” and then “Custom Reports.”
- Set Up the Report: Click on “New Custom Report.” Give your report a name and add a descriptive title for each tab you plan to create.
- Select Metrics and Dimensions: Choose the metrics and dimensions that are relevant to your analysis. For example, if you’re focusing on e-commerce, you might select metrics like “Revenue” and “Transactions” and dimensions like “Source/Medium” and “Landing Page.”
- Filter Your Data: Add filters to refine your data. This could include excluding internal traffic or focusing on a specific campaign.
- Save and Share: Once you’ve configured your report, save it and share it with your team. You can also schedule email deliveries of the report for regular updates.
Advanced Custom Reports Techniques
Segmentation
Segmentation allows you to break down your data into meaningful groups. In custom reports, you can apply segments to analyze specific subsets of your data, such as new vs. returning users, mobile vs. desktop traffic, or high-value customers.
Calculated Metrics
Calculated metrics enable you to create new metrics based on existing data. For example, you can calculate the average order value by dividing total revenue by the number of transactions. This can provide deeper insights into your business performance.
Multi-Channel Funnels
Understanding the customer journey is crucial for optimizing marketing efforts. Multi-channel funnels in custom reports show how different channels work together to drive conversions. This can help you identify the most effective marketing channels and optimize your budget allocation.
Building Custom Dashboards
Why Use Dashboards?
Dashboards provide a visual summary of your key metrics. They are an excellent tool for quickly monitoring performance and sharing insights with stakeholders. Custom dashboards in Google Analytics allow you to display multiple reports in one place, making it easier to track progress and identify trends.
Creating Your First Custom Dashboard
- Log in to Google Analytics: Navigate to the Google Analytics dashboard and select the account and property you want to work with.
- Access the Customization Tab: In the left-hand menu, click on “Customization” and then “Dashboards.”
- Set Up the Dashboard: Click on “Create” and choose either a blank canvas or a starter dashboard. Give your dashboard a name that reflects its purpose.
- Add Widgets: Add widgets to your dashboard. Widgets can display data in various formats, including charts, tables, and timelines. Choose widgets that best represent the metrics you want to monitor.
- Customize Widgets: Configure each widget by selecting the appropriate metrics, dimensions, and filters. This will ensure your dashboard provides relevant and actionable insights.
- Save and Share: Save your dashboard and share it with your team. You can also schedule email deliveries of the dashboard for regular updates.
Advanced Dashboard Techniques
Real-Time Dashboards
Real-time dashboards display live data, allowing you to monitor activity as it happens. This is particularly useful for tracking campaign performance, website traffic spikes, or real-time sales.
Custom Alerts
Set up custom alerts to notify you when specific conditions are met. For example, you can create an alert for a sudden drop in traffic or a spike in conversion rates. This helps you respond quickly to significant changes in your data.
Integration with Other Tools
Enhance your dashboards by integrating Google Analytics with other tools like Google Data Studio. This enables you to combine data from multiple sources and create more comprehensive reports.
Conclusion
Advanced Google Analytics features like custom reports and dashboards are essential for gaining deeper insights into your website’s performance. By tailoring your data analysis to your specific needs, you can make more informed decisions and drive better results. Whether you’re focusing on e-commerce, user behavior, or marketing campaigns, mastering these tools will enhance your data-driven decision-making in 2024.


Recent Comments